
在实际环境中测试
在生产环境中测试,无水印。
随时随地满足您的需求。
Python PDF库


图形和复杂网络研究是计算机科学和数学的基本概念,用于建模复杂的连接和交互。 图的节点,有时也称为顶点,以及边,有时称为链接,本质上只是实体及其关系的可视化表示和解释,通过连接节点的边来显示。
更广泛地说,用于运输系统、社交网络和通信网络的所有图表都被视为网络。 通过观察图表和网络,我们可以理解并解决与连接、流动和网络结构相关的问题。 这种工作为多个领域提供了见解,从社会动态和组织结构到有效路由和优化的算法。 这些概念在网络理论、运筹学和数据科学中非常重要。
在本文中,我们使用igraph展示如何使用灵活且可靠的IronPDF库生成网络图并将其打印为PDF文件。
Igraph 是一个强大的 Python 包,用于生成、操作和分析复杂图形和网络。 它提供了一个庞大的工具包来处理图形,从生成到操作及其可视化。 Python igraph 通过许多算法来实现网络分析,这些算法计算各种中心性、最短路径、社区结构等指标。
因此,该库为有向和无向图提供了良好的可视化效果,具有自适应布局和属性。Igraph 非常灵活且快速,常用于分析复杂关系数据的应用中,例如数据科学、计算生物学和社会网络研究。
首先,通过以下步骤开始在Python中进行基础图论操作和配置,以创建、配置和使用igraph。
您必须先安装igraph软件包。可以使用以下pip命令来实现:
pip install igraphpip install igraph以下是一个简单的示例,向您展示如何使用 igraph 构建和设置图表:
from igraph import Graph, plot
# Create an empty graph
g = Graph()
# Add vertices (nodes)
g.add_vertices(5)  # Adding 5 vertices
# Add edges (connections between vertices)
g.add_edges([(0, 1), (1, 2), (2, 3), (3, 4), (4, 0), (0, 2)])  # Adding edges
# Add vertex ids and edge attributes
g.vs["name"] = ["A", "B", "C", "D", "E"]  # Vertex labels
g.es["weight"] = [1, 2, 3, 4, 5, 6]  # Edge weights
# Basic graph structural properties
print("Number of vertices:", g.vcount())
print("Number of edges:", g.ecount())
print("Graph summary:", g.summary())
py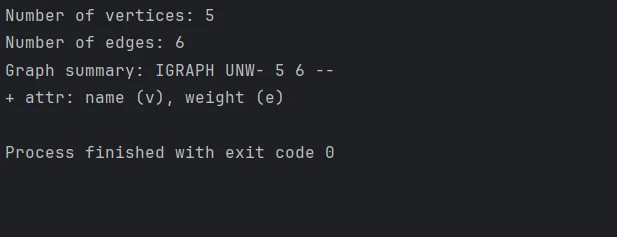
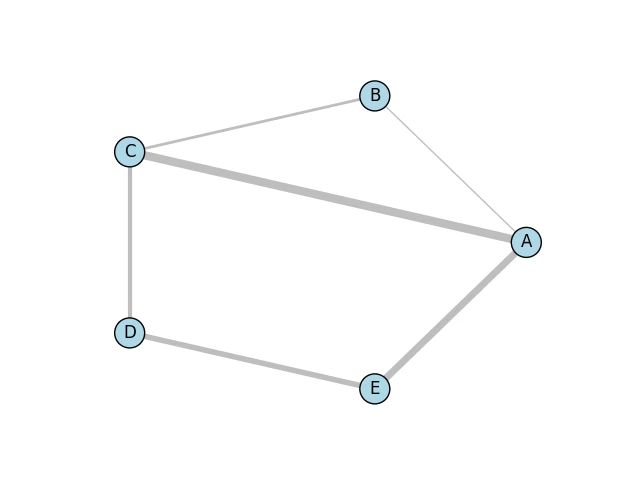
我们可以使用一些 igraph 的内置功能绘制图形。 通过以下方式更改外观和布局:
# Define a layout for the graph
layout = g.layout("circle")  # Layout in a circular arrangement
# Plot the graph with labels and custom options
plot(
    g,
    layout=layout,
    vertex_label=g.vs["name"],  # Label vertices
    vertex_color="lightblue",    # Vertex color
    edge_width=g.es["weight"],   # Edge width based on weight
    vertex_size=30,              # Vertex size
    edge_color="grey",           # Edge color
    bbox=(300, 300),             # Size of the plot
    margin=20                    # Margin around the plot
)
g.savefig('exampleGraph.png') # You can also save to many file formatspy下面是使用Matplotlib库和Cairo库的Python绑定生成的简单图像。
执行各种图操作和分析,如计算中心性、发现社区或识别最短路径:
# Calculate degree centrality for each vertex
degrees = g.degree()
print("Degrees of vertices:", degrees)
# Compute shortest path between two vertices that dont have a predefined
# distance
shortest_path = g.shortest_paths_dijkstra(source=0, target=3)
print("Shortest path from vertex 0 to 3:", shortest_path)
# Detect communities using the Louvain method
communities = g.community_multilevel()
print("Detected communities:", communities)
py

我们甚至可以使用 IronPDF Python 模块以编程方式生成和编辑 PDF。 使用此库,您将拥有强大的能力可以从HTML创建PDF文档、合并两个或多个PDF文档,甚至可以使用现有的PDF并对其进行修改以包含文本、照片和注释。 IronPDF 使您能够从任何 HTML 网站或网页内容生成专业质量的 PDF,这些 PDF 可用于生成报告、发票和具有预设样式的其他文档。
其一些高级功能包括编辑页面布局、文档加密和从PDF中提取文本。 如果开发人员能够更好地处理PDF,将更有助于提升您产品的总体效用。
您可以使用以下命令来安装这些软件包,从而为您的项目启用IronPDF功能的Python接口:
pip install ironpdfpip install ironpdf在 Python 中合并 igraph 和 IronPDF 的步骤如下:首先,您将使用 igraph 创建一个图并显示它。 然后,将生成的可视化内容转换为PDF。
from igraph import Graph, plot
import matplotlib.pyplot as plt
from ironpdf import *     import warnings
warnings.filterwarnings('ignore')
# Ensure that you have replaces the string with your own license key
License.LicenseKey = "YOUR LICENSE KEY GOES HERE";
# Create an empty graph
g = Graph()
# Add adjacent vertices (nodes)
g.add_vertices(5)  # Adding 5 vertices
# Add edges (connections between vertices)
g.add_edges([(0, 1), (1, 2), (2, 3), (3, 4), (4, 0), (0, 2)])  # Adding edges
# Add vertex and edge attributes
g.vs["name"] = ["A", "B", "C", "D", "E"]  # Vertex labels
g.es["weight"] = [1, 2, 3, 4, 5, 6]  # Edge weights
# Define a layout for the graph
layout = g.layout("circle")  # Layout in a circular arrangement
# Create a plot using matplotlib
fig, ax = plt.subplots()
# Plot the geometric random graph
plot(
    g,
    target=ax,
    layout=layout,
    vertex_label=g.vs["name"],  # Label vertices
    vertex_color="lightblue",    # Vertex color
    edge_width=g.es["weight"],   # Edge width based on weight
    vertex_size=30,              # Vertex size
    edge_color="grey",           # Edge color
    bbox=(300, 300),             # Size of the plot
    margin=20                    # Margin around the plot
)
# save in different file formats
plt.savefig('result.png')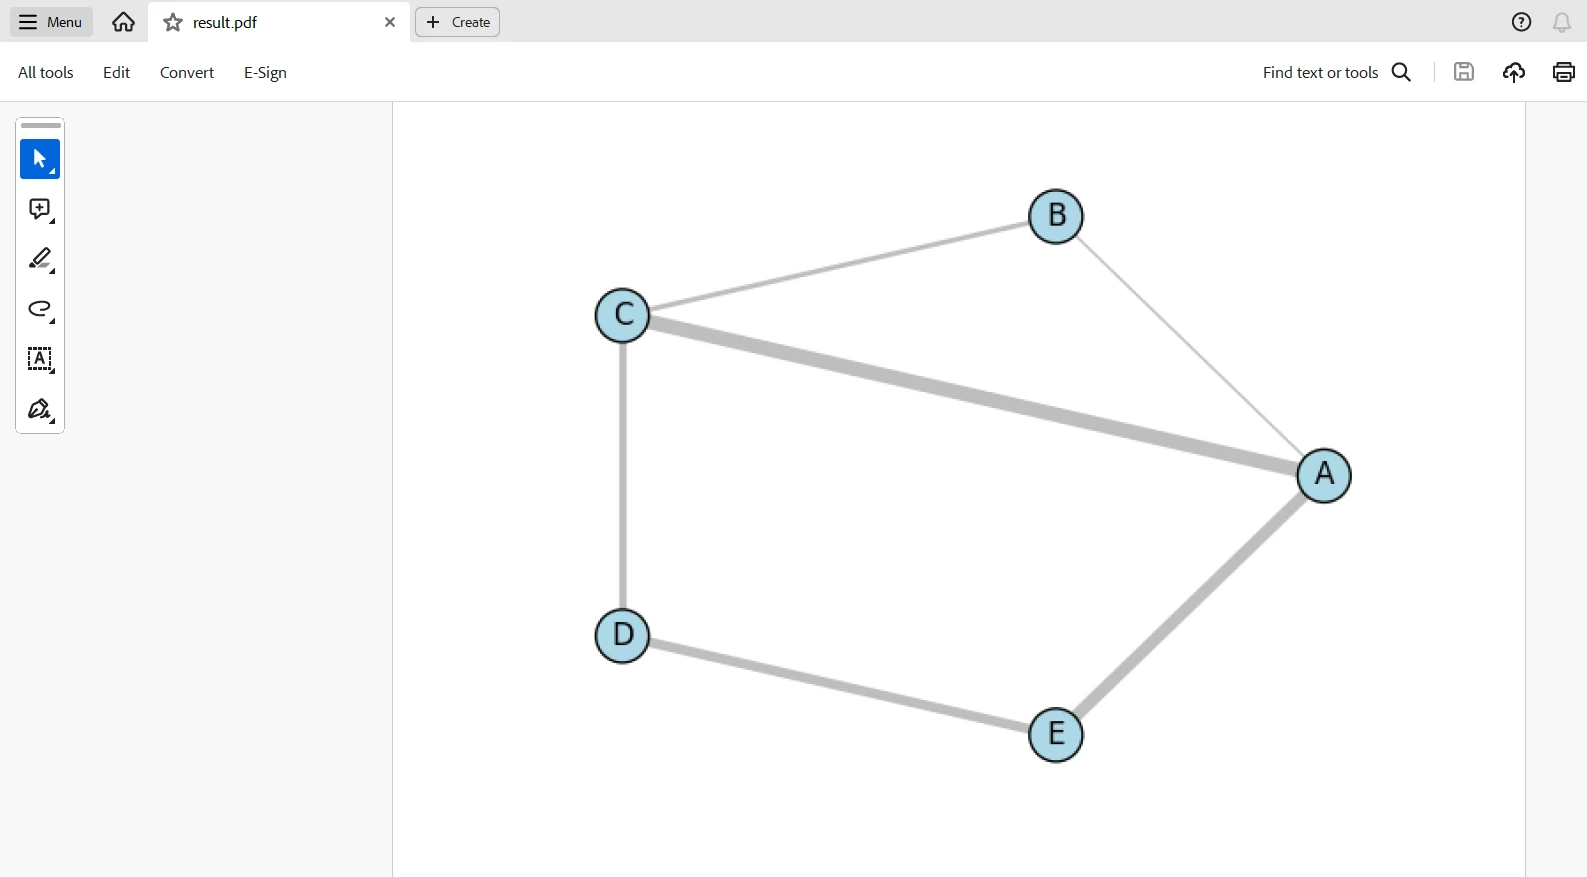
ImageToPdfConverter.ImageToPdf('result.png').SaveAs("result.pdf")py此脚本将通过igraph生成图表,通过matplotlib进行可视化,然后使用IronPDF将图表转换为PDF。 此代码将导入所需的所有库,并设置IronPDF的许可证密钥。 创建一个包含五个顶点和六条边的空图,并添加权重和标签以提高清晰度。
然后将图形以圆形布局,绘图涉及matplotlib的多个可视化属性,例如顶点的颜色及其大小,以及边的线宽。 之后,结果作为图像文件 result.png 被保存。 最后,它被转换为 PDF,即 result.pdf,使用 IronPDF 的ImageToPdfConverter。 图形创建、可视化和生成PDF被合并到一个工作流程中。
需要许可密钥以使代码在没有水印的情况下工作。 您可以通过此链接注册免费试用许可证。 请注意,您可以在不提供身份证明的情况下注册。 您只需输入您的电子邮件地址即可注册免费试用版。

借助IronPDF和igraph的强大功能,您可以开发可视化和呈现复杂图形数据的解决方案。 通过igraph,你可以轻松创建和分析复杂网络,同时使用IronPDF将数据可视化无缝转换为专业级PDF文档。 这些结合的力量将帮助您开发综合报告,包括图表分析和可视化表示。
这种集成支持开发需要全面网络文档的各种应用程序,包括学术研究、商业分析和数据驱动的报告。 此外,它将高质量的文档输出与非常强大的图形操作能力结合在一起。最重要的是,Iron Software提供多种库,使开发适用于多种平台和操作系统(如Windows、Android、MAC、Linux等)的应用程序变得更加容易。
无需信用卡
您的试用密钥应该在邮件中。![]() 试用表格已
试用表格已
成功提交。
如果没有,请联系
support@ironsoftware.com

免费开始
无需信用卡
在生产环境中测试,无水印。
随时随地满足您的需求。
获得30天的全功能产品。
几分钟内就能启动并运行。
在您的产品试用期间,全面访问我们的支持工程团队。


预约30分钟的个人演示。
无需合同,无需卡片信息,无需承诺。